R has been an indispensable tool since I started working with it about five years ago. Of course in my day job as a data scientist I couldn’t live without it, but it also proved to be a great aid in private life. Recently we bought our first house and R came to the rescue several times in the process. We compared the impact of different mortgages on our finances in ten and twenty years time and I kept an eye on our spending through a Shiny app (I’ll admit the latter would have been less time consuming if I would have done it in Excel, like normal people).
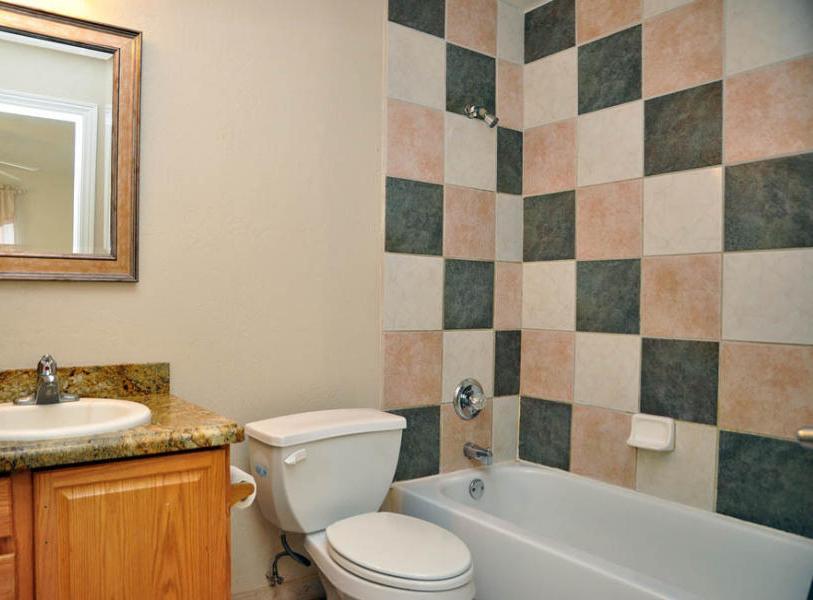
I would never had expected that R would also be the go-to tool for decorating our bathrooms. When looking for inspiration online and in showrooms we came across many ugly and boring examples. Just when we were about to settle for a design like this
we came to the luminous idea to create a random pattern from a few colors we liked. It is very difficult for human beings to produce a random pattern, since we tend to avoid clutters of the same color. Of course R’s random number generator does not suffer from this. Turning the random pattern into a nice design is (of course!) done with geom_tile from ggplot2. It is funny how you keep underestimating randomness, even when you work with data daily. I was looking for a nicely scattered design of the four colors we selected, rather we got Tetris-on-steroids patterns like this
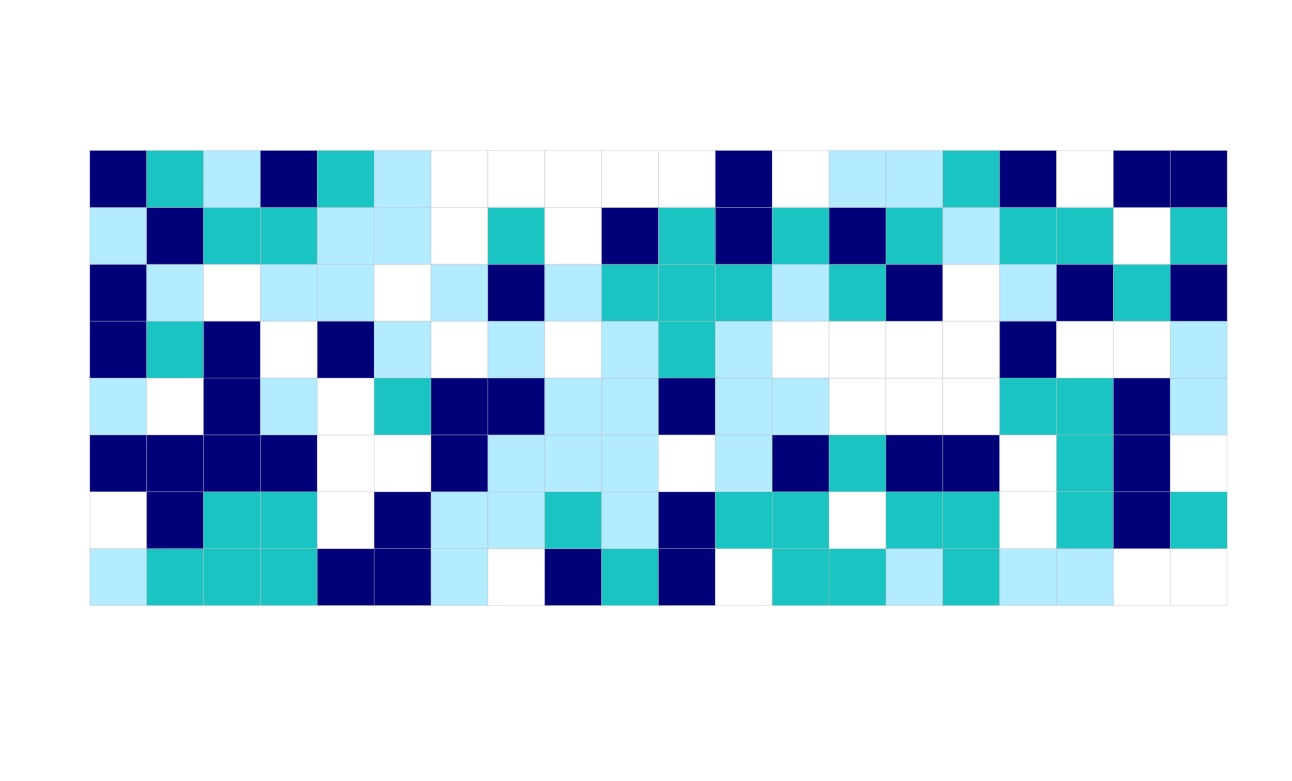
Nature needed to be a bit constrained in order to produce the design we were after. An adjustment was made to the function by adding a parameter for the maximum number of adjacent tiles of the same color. Allowing for two adjacent tiles of the same color gave us a very nice result.
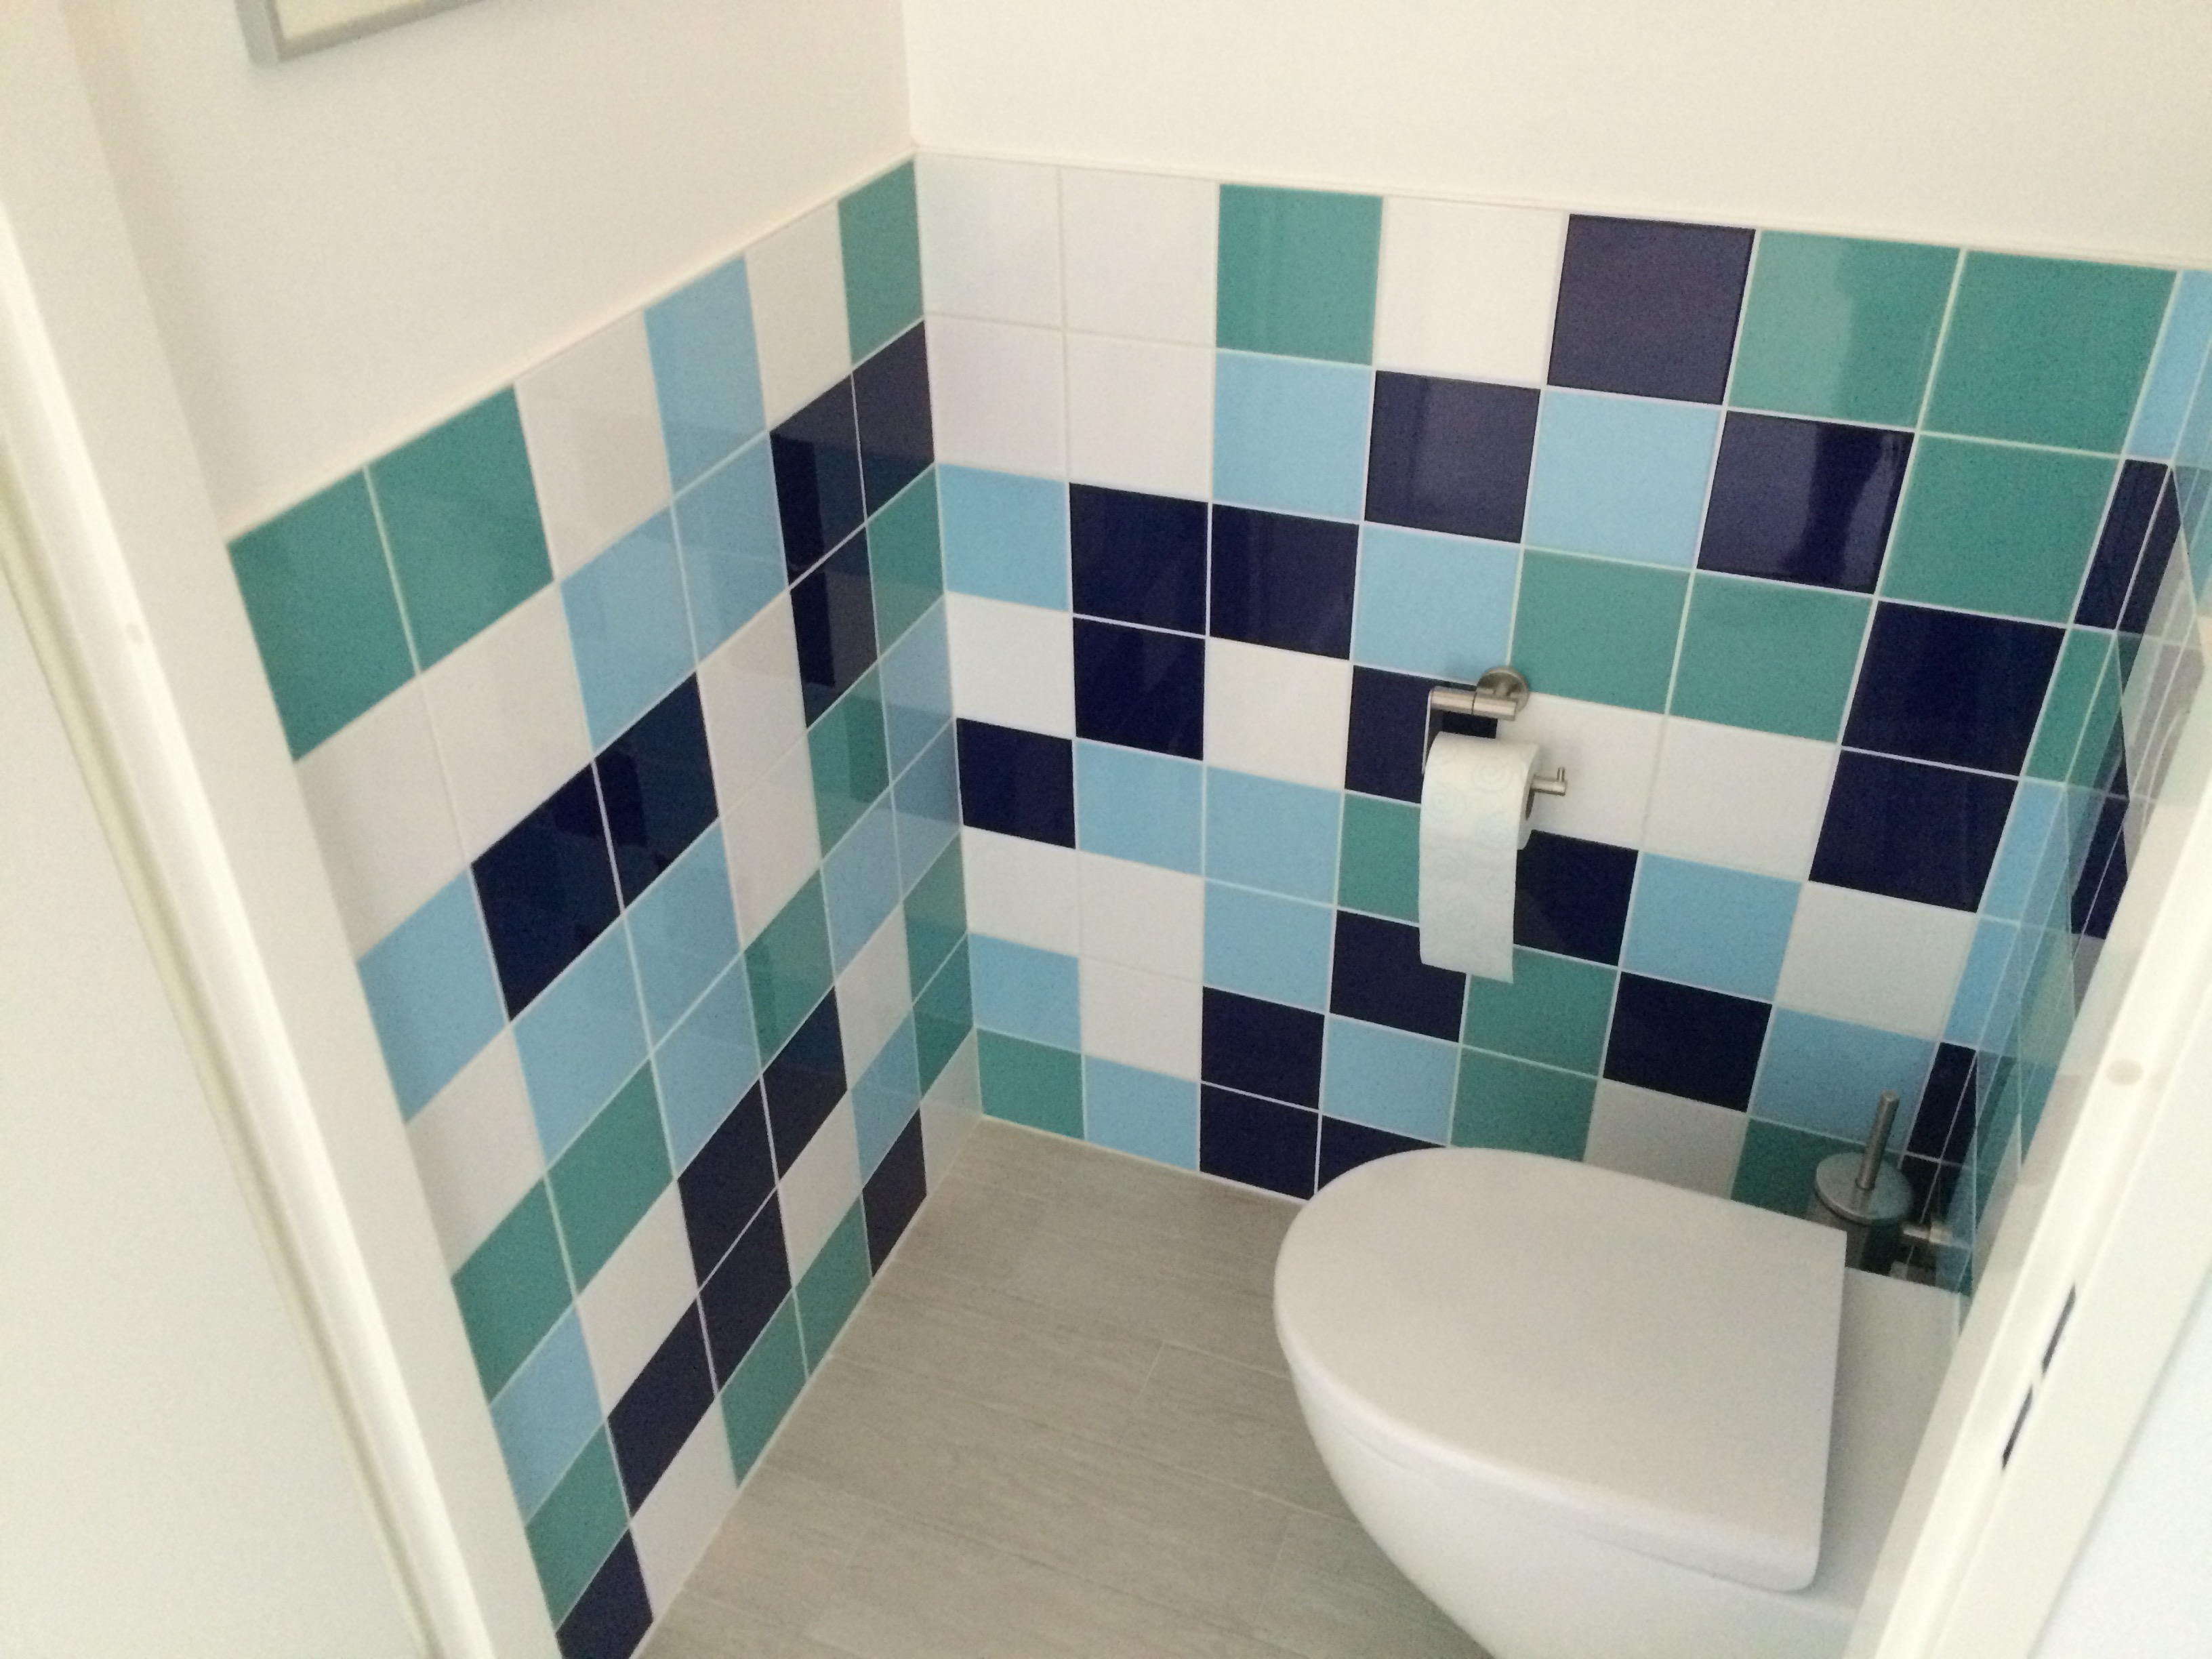
Here are the functions that were used, the first two are helpers for the main function. Go ahead and redecorate your own bathroom!
library(ggplot2)
library(dplyr)
library(data.table)
##
## This data.table install has not detected OpenMP support. It will work but slower in single threaded mode.
library(magrittr)

# helper function that checks for the next tile to be sampled if there
# are any colors that should be excluded because the max adjacent was
# reached either vertically or horizontally
check_colors <- function(plot_data,
                         cur_width,
                         cur_height,
                         m_a){
  if(cur_height > m_a){
    colors_height <-
      plot_data[Height %in% (cur_height-(m_a)):(cur_height-1) &
                  Width == cur_width, color] %>% unique
  } else {

    colors_height <- NULL
  }

  if(cur_width > m_a){
    colors_width <-
      plot_data[Width %in% (cur_width-(m_a)):(cur_width-1) &
                  Height == cur_height, color] %>% unique
  } else {
    colors_width <- NULL
  }

  if(length(colors_height) > 1) colors_height <- NULL
  if(length(colors_width) > 1) colors_width <- NULL
  exclude <- c(colors_height, colors_width)
  if(length(exclude) == 0) exclude <- 0

  return(exclude)
}

# helper function that samples a tile color from a vector with remaining tiles
# excluding a color if necesarry. Returns the sample color and the vector with
# remaining colors for the next iteration.
sample_color <- function(exclude = 0,
                         cts){
  if(cts %>% is_in(exclude) %>% all){
    stop('There is no valid solution due to adjacency constraint, please try again')
  }

  valid_color <- FALSE
  while(valid_color == FALSE){
    color <- sample(cts, 1)
    if(color %>% is_in(exclude) %>% not) {
      valid_color <- TRUE
      return_list <- list(color = color,
                          cts =
                            cts[-((cts == color) %>% which.max)])
    }
  }
  return(return_list)
}

# This function will generate a random pattern of tiles.
tiles_pattern <- function(
  colors         = c('darkblue', 'cyan3', 'lightblue1', 'white'),   # vector with the colors
  nr_of_each_col = rep(40, 4),     # prevalence of each color in colors vector
  nr_height      = 8, # nr of tiles in vertical direction
  nr_width       = 20, # nr of tiles in horizontal directions
  max_adjacent   = 2)  # maximimum nr of adjacent tiles of the same color
{

  if(length(colors) != length(nr_of_each_col)){
    stop('nr_of_each_col vector should be same length as the colors vector')
  }
  if(sum(nr_of_each_col) != nr_height * nr_width){
    stop('Sum nr_of_each_col should equal nr_height * nr_width')
  }

  plot_data <- expand.grid(1:nr_height, 1:nr_width) %>% as.data.table
  colnames(plot_data) <- c('Height', 'Width')
  plot_data$color <- integer(nrow(plot_data))

  colors_to_sample <- rep(1:length(colors), nr_of_each_col)

  for(i in 1:(nr_width)){
    for(j in 1:nr_height){
      exclude_iter     <- check_colors(plot_data, i, j, max_adjacent)
      color_iter       <- sample_color(exclude_iter, colors_to_sample)
      plot_data[Height == j & Width == i, color := color_iter$color]
      colors_to_sample <- color_iter$cts
    }
  }

  plot_data[ ,color := color %>% as.character]

  # build the plot
  ggplot(plot_data, aes(Width, Height)) +
    geom_tile(aes(fill = color), col = 'grey') +
    scale_fill_manual(values = c('1' = colors[1],
                                 '2' = colors[2],
                                 '3' = colors[3],
                                 '4' = colors[4])) +
    xlab('') +
    ylab('') +
    guides(fill = FALSE) +
    theme_bw() +
    theme(
      plot.background = element_blank()
      ,panel.grid.major = element_blank()
      ,panel.grid.minor = element_blank()
      ,panel.border = element_blank()
      ,axis.ticks.x = element_blank()
      ,axis.ticks.y = element_blank()
      ,axis.text.x = element_blank()
      ,axis.text.y = element_blank()
    ) +
    coord_fixed()
}