The padr package was designed to prepare datetime data for analysis. That is, to take raw, timestamped data, and quickly convert it into a tidy format that can be analyzed with all the tidyverse tools. Recently, a colleague and I discovered a second use for the package that I had not anticipated: checking data quality. Every analysis should contain checking if data are as expected. In the case of timestamped data, observations are sometimes missing due to technical malfunction of the system that produced them. Here are two examples that show how pad and thicken can be leveraged to detect problems in timestamped data quickly.
Regular observations
Lets imagine our system produces a value every five minutes. We want to analyse the data of the last couple of months and start by some routine checks. We quickly find that the number of records is not what we expected.
library(tidyverse)
library(padr)
regular_system %>% head
## # A tibble: 6 × 2
##             timestamp  value
##                <dttm>  <dbl>
## 1 2017-03-01 00:00:00 423.69
## 2 2017-03-01 00:05:00 434.51
## 3 2017-03-01 00:10:00 206.01
## 4 2017-03-01 00:15:00 432.83
## 5 2017-03-01 00:20:00 220.07
## 6 2017-03-01 00:25:00 393.44
seq(regular_system$timestamp %>% min, regular_system$timestamp %>% max,
    by = "5 min") %>% length()
## [1] 32456
nrow(regular_system)
## [1] 32454
Two observations are missing here, with pad they are located in no time.
regular_system %>%
  mutate(check_var = 1) %>%
  pad() %>%
  filter(is.na(check_var))
## pad applied on the interval: 5 min
## # A tibble: 2 × 3
##             timestamp value check_var
##                <dttm> <dbl>     <dbl>
## 1 2017-06-08 11:55:00    NA        NA
## 2 2017-06-08 12:00:00    NA        NA
There we are, aparrantly the system took a lunch break on June the 8th.
Irregular observations
Now a more common situation. The system only produces data when it has something to tell us. This makes the observations irregular. This server produces a message each time some event happened.
irregular_system %>% head
## # A tibble: 6 × 2
##            time_stamp  message
##                <dttm>    <chr>
## 1 2016-10-09 00:02:01  QL2341@
## 2 2016-10-09 00:07:01 #A222IWL
## 3 2016-10-09 00:11:01  QL2341@
## 4 2016-10-09 00:17:00     WW#5
## 5 2016-10-09 00:17:00  QL2341@
## 6 2016-10-09 00:17:01     WW#5
Also here our server might be temporarily down, however, this is not so easy to locate. It is helpful here to apply thicken, then aggregate, pad, and fill, and finally plot the result. We might want to look at several different interval, lets make it as generic as possible.
thicken_plot <- function(x, interval) {
  x %>% thicken(interval, "ts_thick") %>%
    count(ts_thick) %>%
    pad() %>%
    fill_by_value() %>%
    ggplot(aes(ts_thick, n)) +
    geom_line()
}
Lets look at 10 minute intervals.
thicken_plot(irregular_system, "10 min")
## pad applied on the interval: 10 min
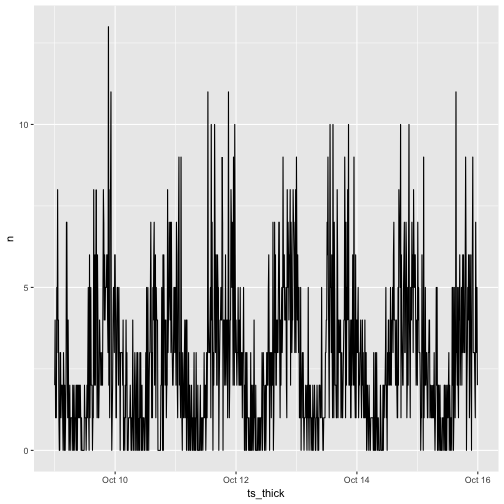
Thats not too helpful, maybe a little coarser.
thicken_plot(irregular_system, "30 min")
## pad applied on the interval: 30 min
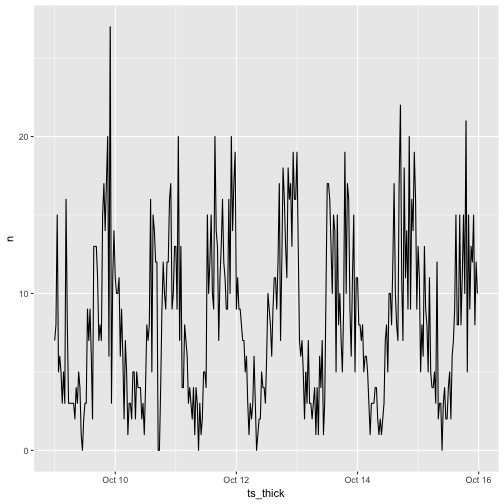
Now we see a dip at the middle of the day for October 10th, where for all the other days there is ample activty during these hours. There must be something wrong here that has to be sorted out. That will wrap up these two quick examples of how to use padr for data quality checking.
I will present the package during a lightning talk at useR next week (Thursday 5:50 pm at 4.02 Wild Gallery). Hope to meet many of you during the conference!
Edit: creation of the two data sets
The two data sets were created manually for demonstrations purposes. Since it was requested to provide the code that created these sets, see below.
library(tidyverse)
library(padr)
library(lubridate)
set.seed(234)
n <- 32456
regular_system <- data_frame(timestamp = seq(ymd_hms("20170301 000000"),
                                             length.out = n, by = "5 min"),
                                             value = round(runif(n, 200, 500)
                                                           ,2))
regular_system <- regular_system[-c(28656, 28657), ]

attr(emergency$time_stamp, 'tzone') <- "UTC"
irregular_system <- emergency %>% thicken("week") %>%
  filter(time_stamp_week == as.Date("2016-10-09")) %>%
  select(time_stamp)

messages <- c("#A222IWL", "WW34", "WW#5", "QL2341@")
irregular_system <- irregular_system %>%
  mutate(message = sample(messages, n(), TRUE)) %>%
  filter(time_stamp < ymd_hms("2016-10-10 16:55:02") |
         time_stamp > ymd_hms("2016-10-10 18:08:32"))