Last week I blogged about the dutchmasters color palettes package, which was inspired
by the wonderful ochRe package. As
mentioned I shamelessly copied the package. I replaced the list with character
vectors containing hex colors and did a find and replace to make it
dutchmasters instead of ochRe. This was pretty ugly. I realized that when
we would refactor the ochRe functions, thus creating functions that create the functions, there would no longer be a need to copy-paste and find-and-replace. So that is what I did. I refactored and expanded ochRe’s chore into paletti. (Name chosen because I liked the ring of it). You grab it from Github, with devtools::install_github("edwinth/paletti").
Single palettes
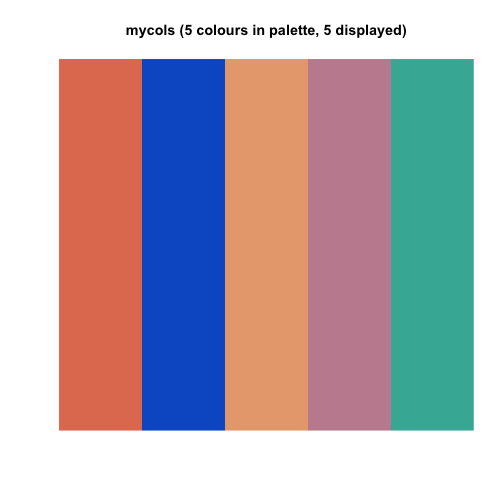
paletti takes both single palettes (character vectors with hex codes) and
lists with palettes, like the ochRe and dutchmasters lists. Lets start with
a single palette, this might be useful when you want your coporate identity
colors translated into R. Here I just pick some colors found on the interweb
library(paletti)
library(ggplot2)
mycols <- c(
  red    = "#E27D60",
  blue   = "#085DCB",
  orange = "#E8A87C",
  purple = "#C38D9E",
  green  = "#41B3A3"
)
viz_palette(mycols)
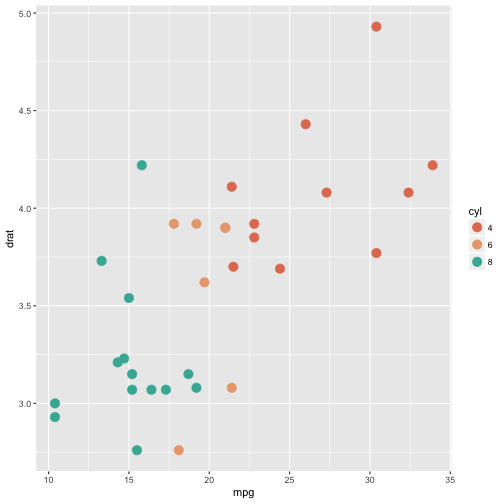
Now, ochRe provided us with two functions, one two create a ggplot scale for
colours and to create one for fills. These functions can be created in the
following fashion
mycols_fill  <- get_scale_fill(get_pal(mycols))
mycols_color <- get_scale_color(get_pal(mycols))
Both now can be used in ggplot
mtcars$cyl <- as.character(mtcars$cyl)
col_plot <- ggplot(mtcars, aes(mpg, drat, color = cyl)) +
  geom_point(size = 4)
col_plot + mycols_color()
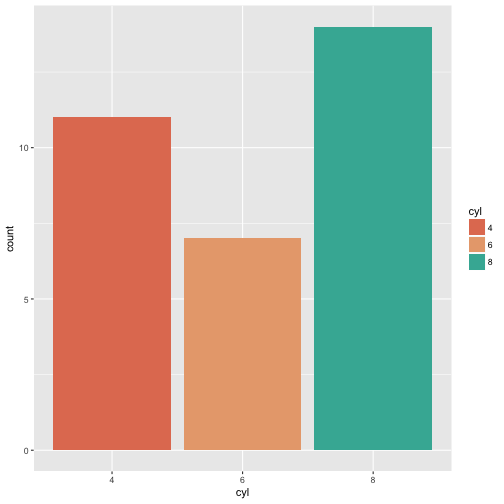
fill_plot <- ggplot(mtcars, aes(cyl, fill = cyl)) +
  geom_bar()
fill_plot + mycols_fill()
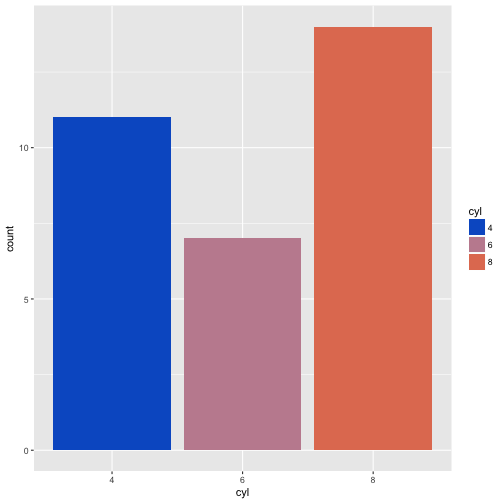
Now, I said I expanded the ochRe code a bit. The function get_hex will
produce a function that will return a function in which you can directly return
the hex code by typing its unquoted name. Handy if you want an exact color from
your palette. Prerequisit is that your palette is a named character vector.
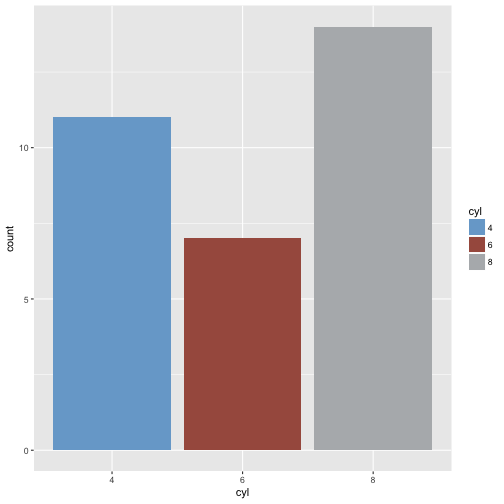
mycols_hex <- get_hex(mycols)
fill_plot + scale_fill_manual(values = mycols_hex(blue, purple, red))
Multiple palettes in a list
Both ochRe and dutchmasters offer multiple palettes in a list. The only
difference from a single palette is that in the returned function you have to
specify the name of the palette youw want to use. If you don’t, it defaults to
the first palette in the list.
ochRe_col         <- get_scale_color(get_pal(ochre_palettes))
dutchmasters_fill <- get_scale_fill(get_pal(dutchmasters))

col_plot + ochRe_col("lorikeet")
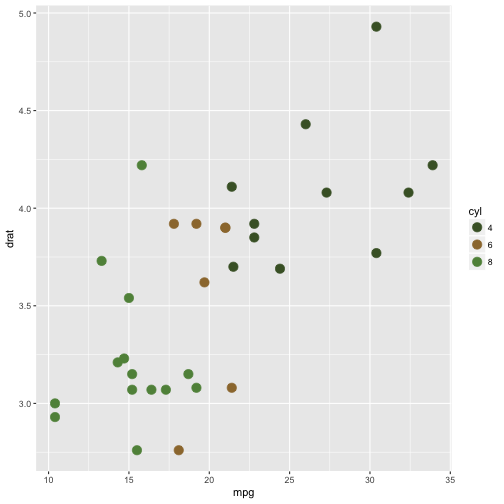
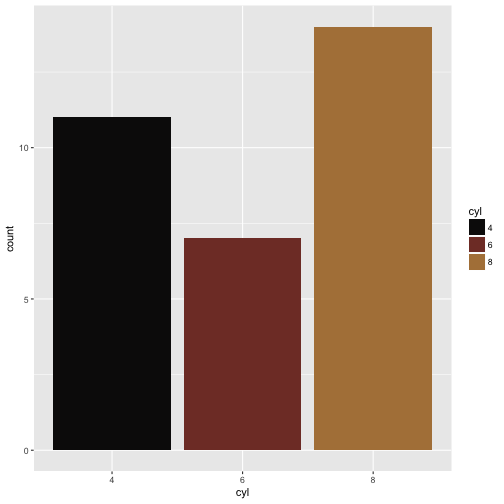
fill_plot + dutchmasters_fill("view_of_Delft")
And the same holds for the get_hex function. You can feed a list with palettes
as well. Note that the palettes that you are going to call must have named
elements.
dutchmasters_hex <- get_hex(dutchmasters)
fill_plot + scale_fill_manual(values = dutchmasters_hex("anatomy",
                              black(cloak), red(muscle), brown(table)))
That’s it, off you go! Add your own color palette(s) and start plotting. Once
again a major thanks to the ochRe team for the inspiration and the foundations
on which paletti is built.