After thickening all the values are either
shifted to the first or the last value of their interval.
This function creates a vector from x, with the values shifted to
the (approximate) center of the interval. This can give a more accurate
picture of the aggregated data when plotting.
center_interval(x, shift = c("up", "down"), interval = NULL)
Arguments
| x | A vector of class |
|---|---|
| shift | "up" or "down". |
| interval | The interval to be used for centering. If |
Value
Vector of the same class as x, with the values shifted to the
(approximate) center.
Details
The interval will be translated to number of days when
x is of class Date, or number of seconds when x is of
class POSIXt. For months and quarters this will be the average
length of the interval. The translated units divided by two
will be added by or subtracted from each value of x.
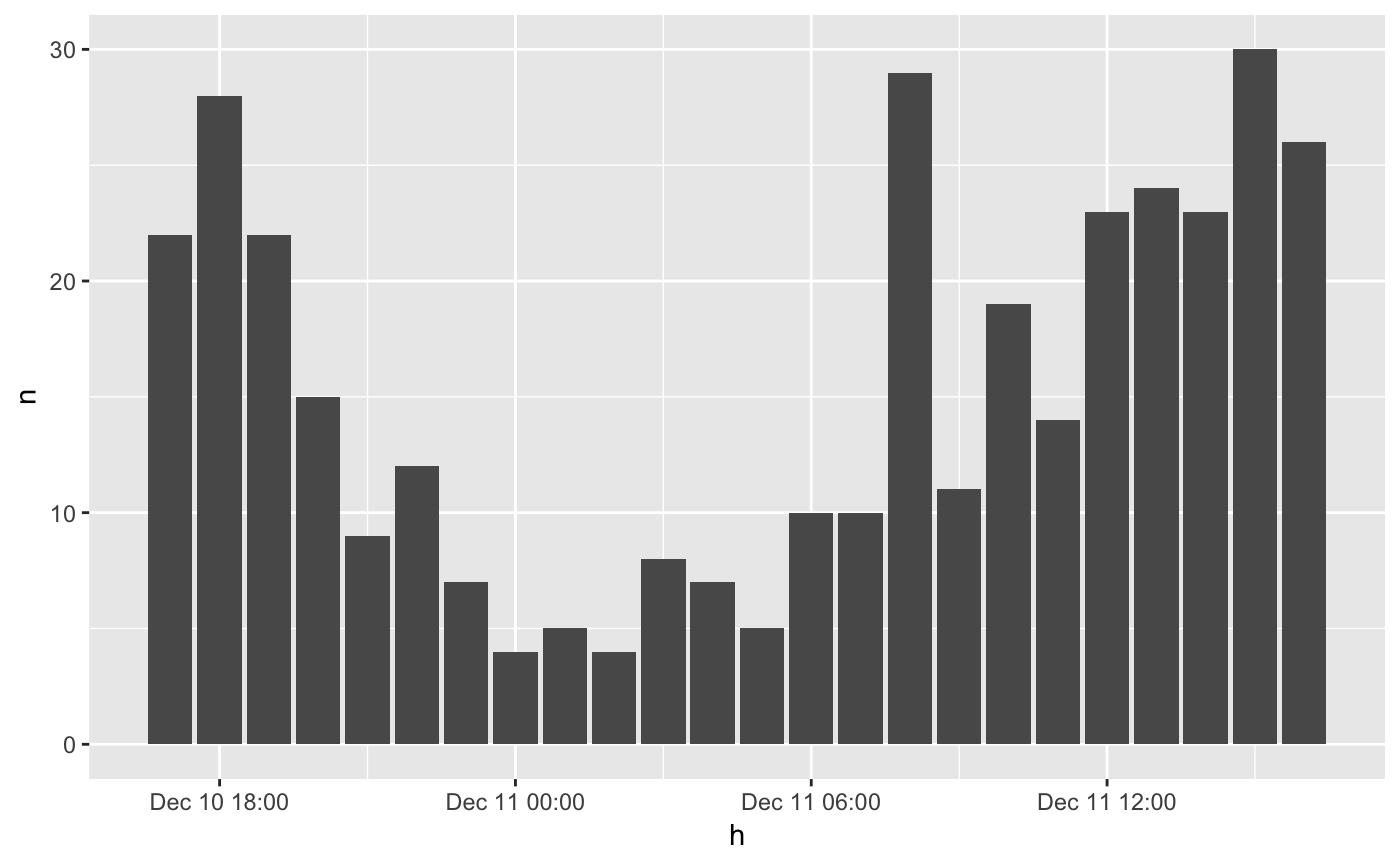
Examples
library(dplyr)#> #>#> #> #>#> #> #>#> #> #>library(ggplot2)#> #> #> #> #>plot_set <- emergency %>% thicken("hour", "h") %>% count(h) %>% head(24) ggplot(plot_set, aes(h, n)) + geom_col()