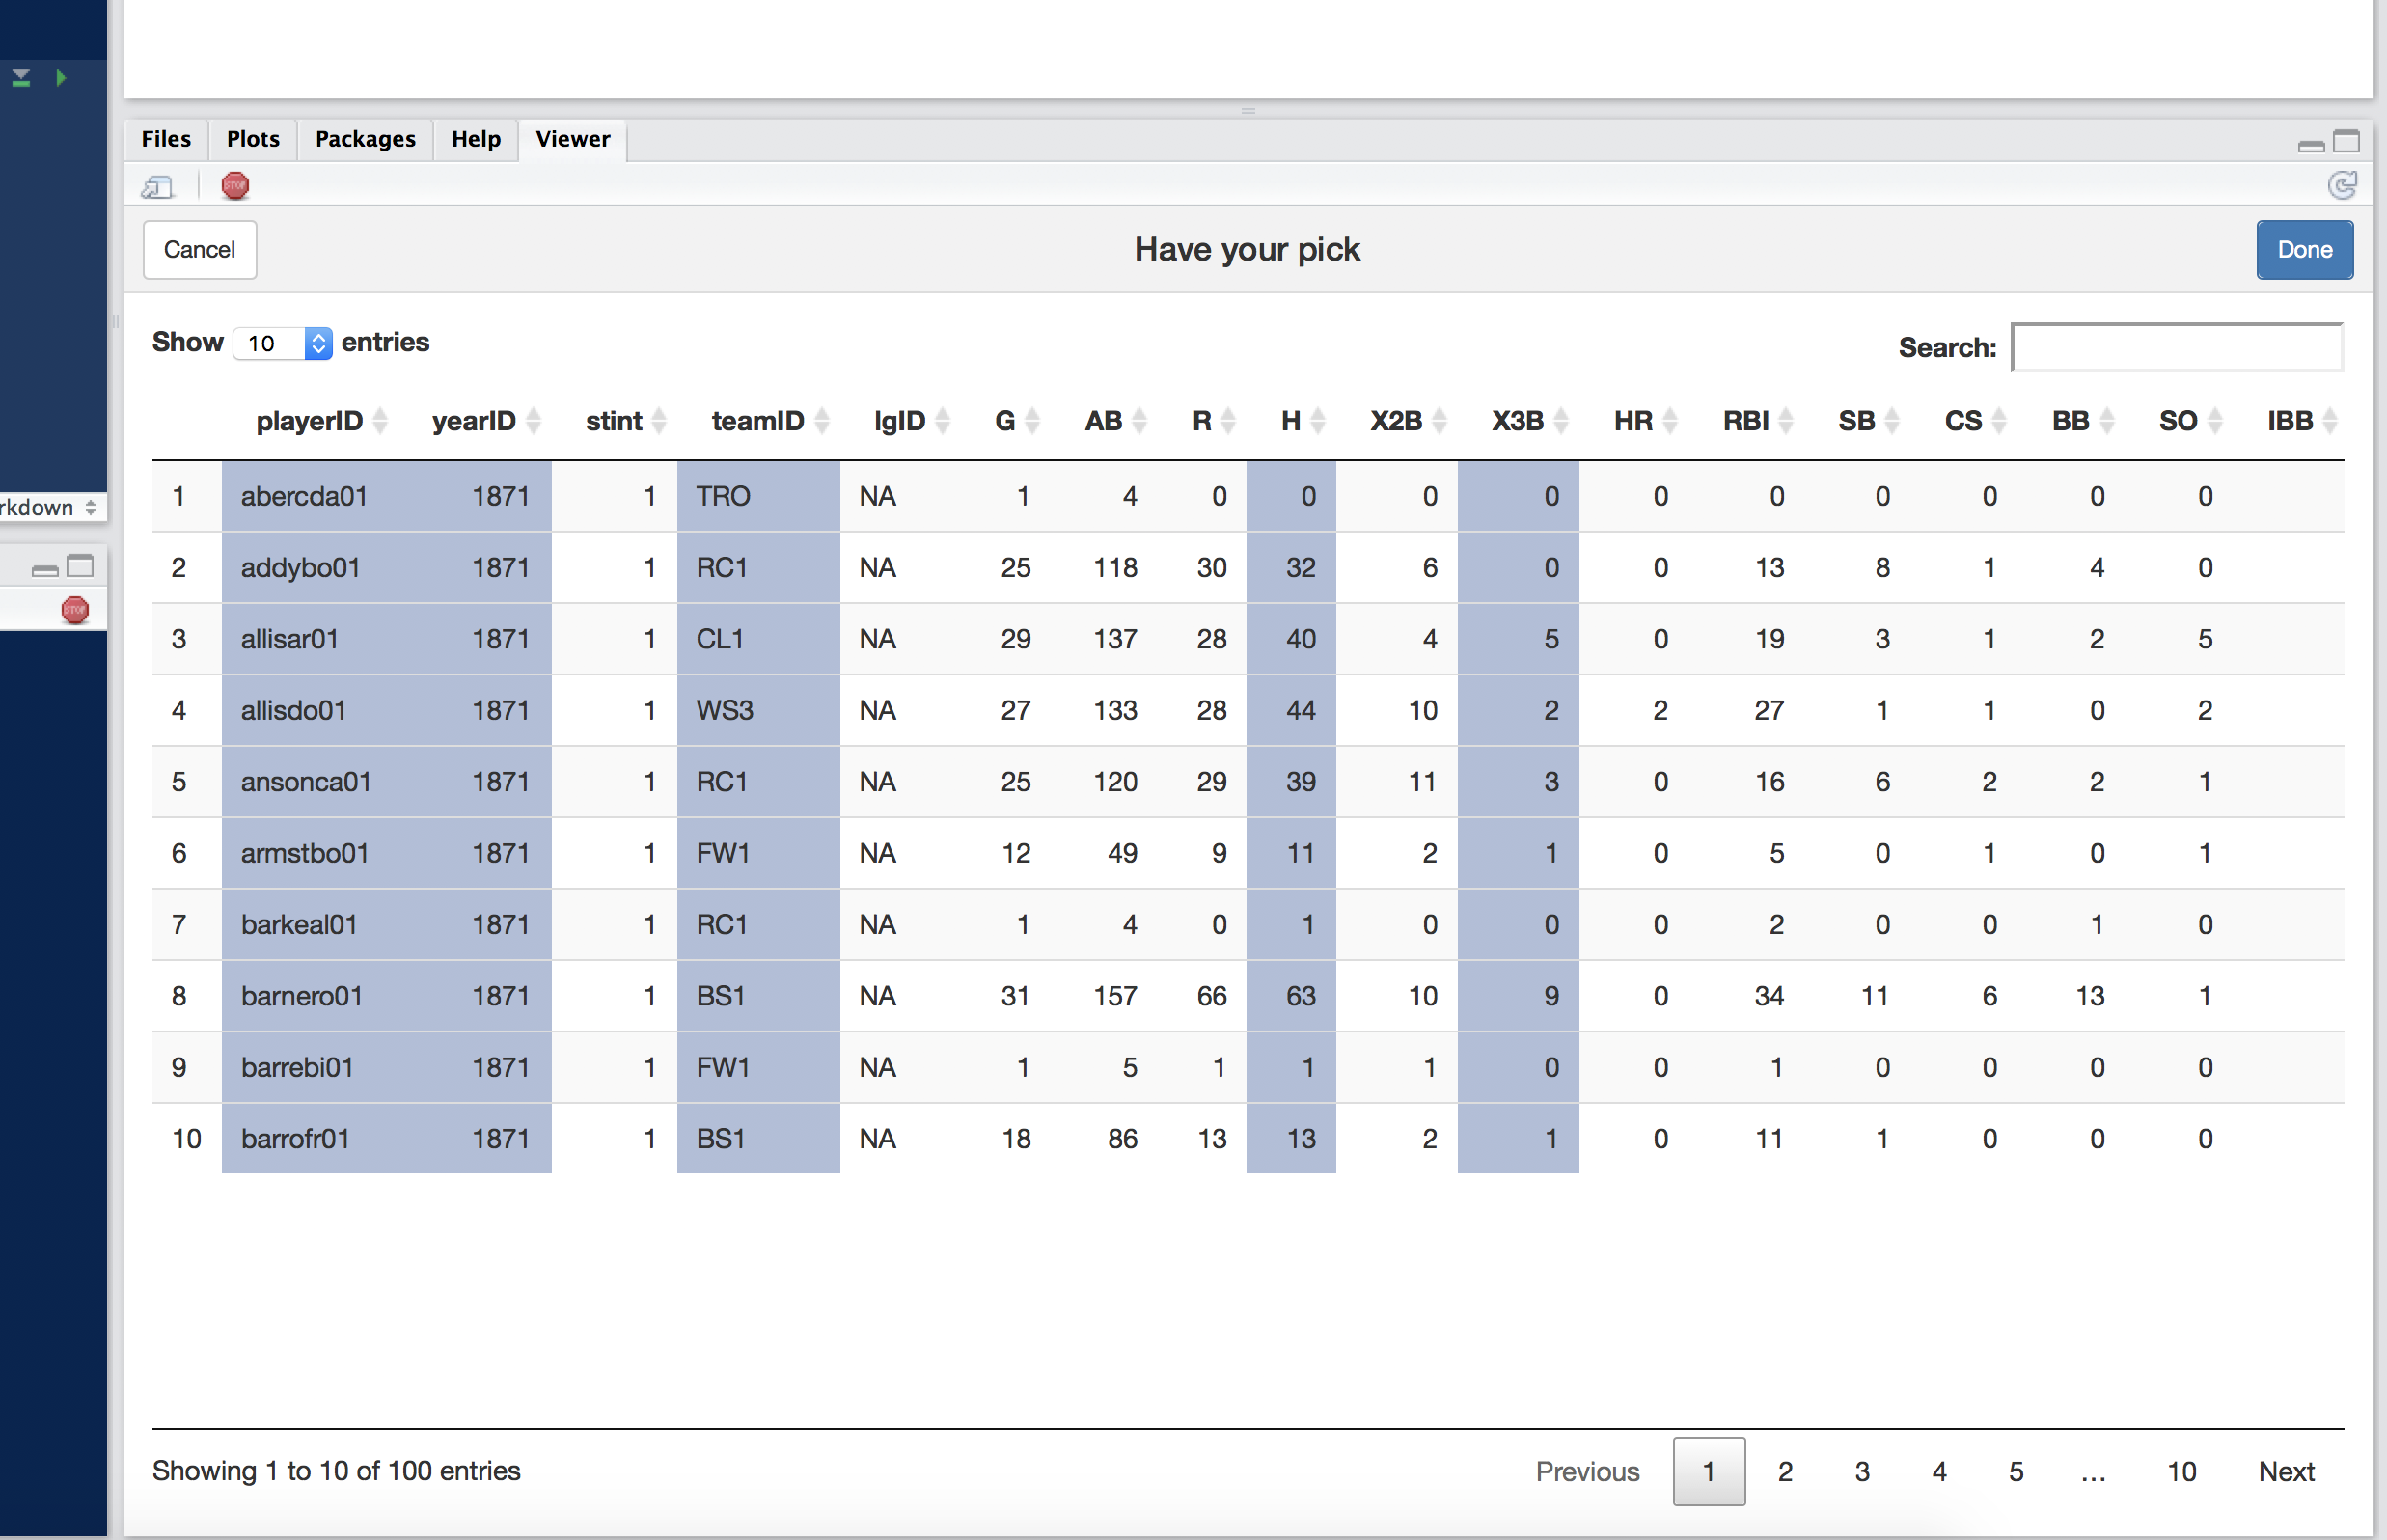
Maybe the following sounds familiar. You have a large data set with many, many columns of which the most are irrelevant to you. Typically, a dump from a database or the full set extracted from an API. Several times I found myself the better part of an afternoon going back and forth between a view of the data where I tried to figure out which columns to keep, and an R session where I wrote the code for creating the subset of columns. Wouldn’t it be nice to have an app in which you could just click the columns you would like to keep? This seemed a perfect opportunity to get my feet wet with Shiny gadgets, which I still wanted to do since I first heard about it on useR2016.
I did not really have a feel for how difficult it would be to build something like this. All I knew was that I probably needed DT to show an interactive data frame. Well it proved very easy to build a tool like this, I was just baffled by how easy it was. Due to the fine documentation of the Shiny functionalities, and excellent examples by Yihui Xie and Joe Cheng, I had it working before I knew. You have to give it up to these guys from RStudio. When you enable someone with barely any knowledge of JavaScript, CSS and html to build an app in an evening, you certainly are doing something right.
So here is how to do it. You simply run the function col_select on a data frame and the mini ui opens. You click the columns you want to keep and store these in a new object like:
Batting_rel <- col_select(Lahman::Batting)

The downside of applying the function in this way, is its lack of reproducibility. Therefore, it is possible to return the dplyr code that makes the selection, instead of the selection itself. The code will be inserted in the R script. In the next example the second line is inserted by running the app and selecting the first four columns.
col_select(Lahman::Batting, ret = 'dplyr_code')
Lahman::Batting %>% select(playerID, yearID, stint, teamID)
Here is the full code for the function. You will notice a third parameter with which you select how many rows are shown in the app. The code can also be found in the R-package that accompanies this blog. The functions from my last post about designing our bathroom with R are now made available here as well.
library(shiny)
library(miniUI)
library(dplyr)
library(DT)
col_select <- function(df,
                       ret = c("df_select", "dplyr_code"),
                       top_n = 100) {
  ret <- match.arg(ret)
  stopifnot(is.data.frame(df))
  df_head <- head(df, top_n)

  ui <- miniPage(
    gadgetTitleBar("Have your pick"),
    miniContentPanel(
      dataTableOutput("selection_df", height = "100%")
    )
  )

  server <- function(input, output, session){
    options(DT.options = list(pageLength = 10))
    output$selection_df <- renderDataTable(
      df_head, server = FALSE, selection = list(target = "column")
    )
    observeEvent(input$done, stopApp(  input$selection_df_columns_selected))
  }

  cols_selected <- runGadget(ui, server)

  if (ret == "df_select") {
    return( df %>% select(cols_selected) )
  } else {
    df_name <- deparse(substitute(df))
    colnames_selected <-  colnames(df)[cols_selected] %>%
      paste(collapse = ", ")
    rstudioapi::insertText(
      paste(df_name, " %>% select(", colnames_selected, ")", sep = "")
    )
  }
}
